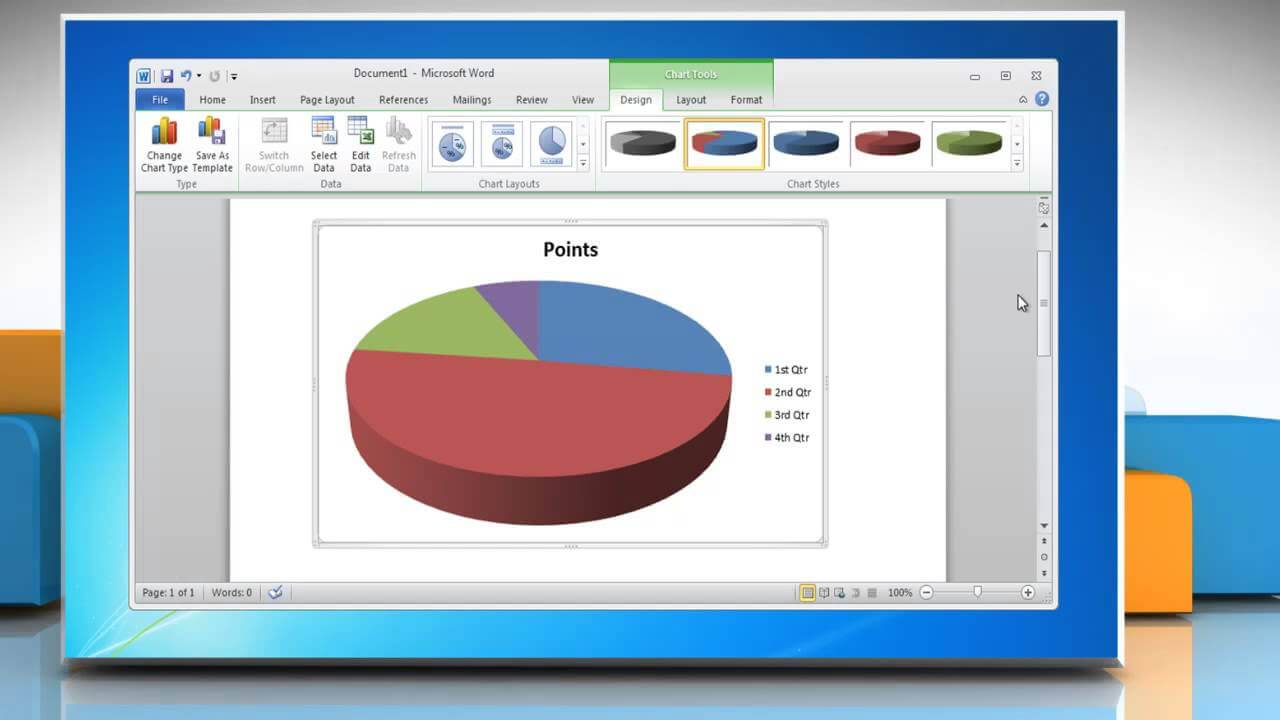
How To Make Bar and Pie Chart in Microsoft Word 2021

Bar and pie charts are some of the most important graphical representations in data analysis, statistics, mathematics, and its related fields of study. A pie chart is a circle which is partitioned into different sectors with each sector representing a specific category while a bar chart is a bar that is also partitioned into different sectors with each of them representing a specific category.
Microsoft Word is also one of the most popular word processing software in the world. Every two (2) years, a new version of the software is released for people to try out and the most recent version of the software is Microsoft Word 2021.
Microsoft Word is one of the most used word processing software in the world, and bar and pie chart are also very necessary, then there is the need for it to be featured in MS Word. For all the previous versions of MS Word, bar and pie chart were featured in them, and the MS Word 2021 happens to be no different.
Persons with MS Word can make bar and pie charts and format them to suit their preferences. In this article, I am going to show you how to make pie and bar charts in Microsoft Word 2021 in a few steps.
How To Make Pie Chart in Microsoft Word 2021
To begin with, make sure you have Microsoft Word 2021 installed and running on your computer
- Open a new Word document
- Click on the Insert tab
- Click on the Chart icon next to Screenshot
- Select Pie from the list of charts displayed
- Choose from the different types of Pie charts available (pie, 3-D pie, pie of pie, doughnut) and click OK afterward
- A spreadsheet will appear on the screen. Replace the data and the with your own information you want to create the pie chart with.
- Close the spreadsheet once you are done entering your data
- Click on the chart and then click on the icons next to it to add your final finishing touches. You can show, hide, or format things like axis titles or data labels under Chart Elements. Also, you can change the colour or style of the chart by using Chart Styles. There are several other finishing touches you can add to your pie chart.
- Once you are done adding your finishing touches, you can save your document to prevent you from losing the pie chart.
How To Make Bar Chart in Microsoft Word 2021
To begin with, make sure you have Microsoft Word 2021 installed and running on your computer
- Open a new Word document
- Click on the Insert tab
- Click on the Chart icon next to Screenshot
- Select Bar from the list of charts displayed
- Choose from the different types of Bar charts available (clustered bar, stacked bar, 100% stacked bar, 3-D clustered bar, 3-D stacked bar, or 3-D 100% stacked bar) and click OK afterward
- A spreadsheet will appear on the screen. Replace the data with your own information you want to create the bar chart with.
- Close the spreadsheet once you are done entering your data
- Click on the chart and then click on the icons next to it to add your final finishing touches. You can show, hide, or format things like axis titles or data labels under Chart Elements. Also, you can change the colour or style of the chart by using Chart Styles. There are several other finishing touches you can add to your bar chart.
- Once you are done adding your finishing touches, you can save your document to prevent you from losing the bar chart.
Conclusion
Unlike some of the other charts in Microsoft Word 2021, bar and pie charts are really easy to create and can also be easily explained. With just a mere glance through it, someone can be able to tell what the data means and what each category represents without consulting the person who created the document.
Bar and pie charts can be used in the workplace during a presentation and report writing. For example, a bar or pie chart can be used to represent the number of people who visited your company’s website and made purchases and those who did not together with their sex and demographics.
Apart from that, persons in the field of mathematical sciences, this article will be very useful and so, if you know anyone in that field of study, please share with him or her as you might be helping him/her at their point of need.
You have to follow the same steps like creating the bar and pie chart. But instead of pie or bar, you have to select line under the chart menu.
A chart is a tool that can be used to explained to data graphically. There are several types of charts in MS Word 2021.
In MS Word, we use the Chart Wizard to create a chart. It can be found in the Insert tab.
